

Supply Chain Management as a value driver: from a cost factor to a balance sheet item
In an SCM optimisation project for a medium-sized engineering firm, we achieved a result that took the management by surprise. Simply by revising the inventory planning parameters, we were able to free up around 12% of tied-up capital. No new software, no ERP replacement, no major reorganisation. Just a management decision regarding the settings for inventory control.
In over 400 projects spanning three decades, we have observed this pattern time and again: in most companies, supply chain management fails to realise 20–35% of its value-enhancement potential. This is not due to poor staff or outdated technology. It is because, in many companies, SCM is treated as a cost centre rather than a strategic management function with direct relevance to the balance sheet.
This article shows how management decisions in supply chain management influence working capital, EBIT margin and free cash flow, how you can specifically calculate SCM’s financial contribution to enterprise value, and which levers you can use to achieve the greatest value contribution.
Why is the contribution of supply chain management to corporate value underestimated?
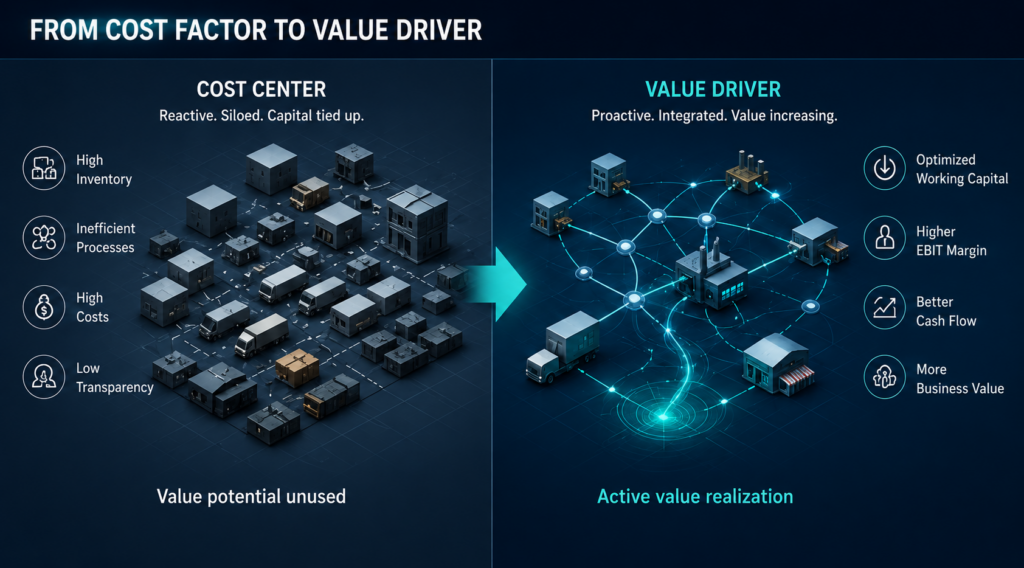
In most companies, supply chain management is still primarily treated as a cost centre, even though management decisions in this area directly influence working capital, EBIT margin and free cash flow.
Historically, SCM was organised as an operational function: transport, warehousing, procurement. Strategic capital allocation remained the preserve of the finance department. This division of labour has become ingrained in structures and mindsets and demonstrably costs companies value today.
In concrete terms, this means: management decisions in SCM (What inventory strategy? What delivery readiness targets? Which planning methodology?) are made by employees with no P&L responsibility and no view of the impact on the balance sheet. The 12% release of capital from our opening example was no coincidence, but the result of someone having, for the first time, clearly modelled the link between planning parameters and tied-up capital.
Another symptom of this misperception: SCM metrics are conspicuously absent from board reports. Stock coverage, delivery readiness, OTIF or forecast accuracy often appear only in divisional reporting, rarely in strategic discussions. If the board views inventory levels merely as a cost line in the budget, rather than as a control variable with balance sheet implications, there is no impetus for the management decisions that would free up capital.
European and North American companies together hold an estimated €1.5 trillion in excess working capital, which could be reduced through more active SCM management (PwC Working Capital Study 2023/24). For the individual SME, this is abstract. What it means in concrete terms: a company with an annual turnover of EUR 30 million that holds EUR 8 million in inventory incurs around EUR 960,000 in inventory costs per year on inventory alone, assuming a relatively low inventory cost rate of 12%.
What is a value driver? A management function acts as a value driver when its decisions have a measurable impact on enterprise value, whether through higher free cash flow, improved margins or reduced cost of capital. SCM meets all three criteria. Our methodological approach demonstrates how we operationalise this connection in practice.
Which financial metrics are directly influenced by supply chain management?
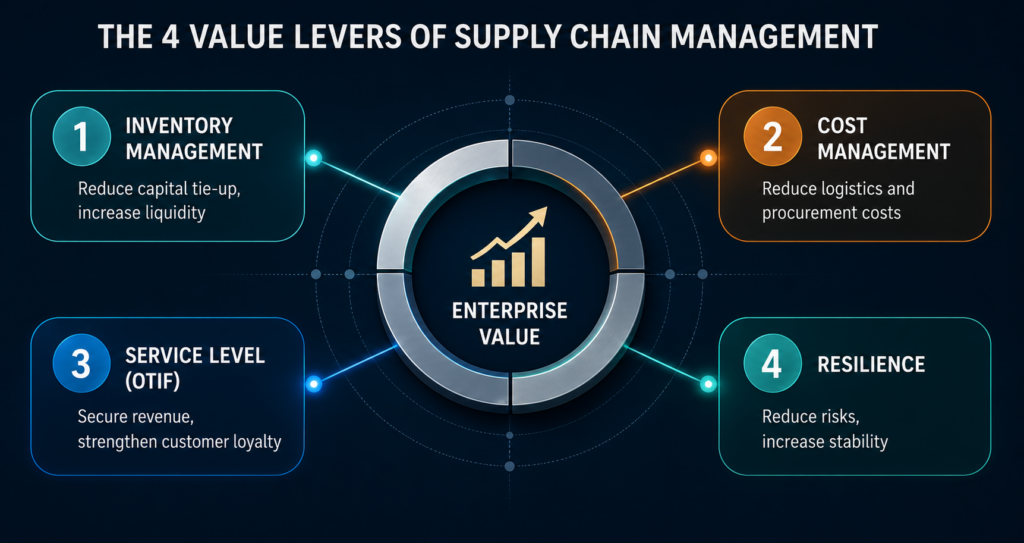
Four financial metrics are directly influenced by management decisions in supply chain management: working capital through inventory strategy; EBIT margin through logistics and procurement cost management; revenue protection through the management of delivery readiness and OTIF; and risk costs through resilience strategy.
When ASOS reduced its inventory levels by around 20% in the 2024 financial year, £143 million in capital was freed up; adjusted EBITDA grew by more than 60% during this period (ASOS FY24 Results Report). This was not a stroke of luck due to market developments. It was the result of an active inventory management decision.
An overview of the four financial levers
The following table shows how SCM management decisions affect financial indicators:
SCM management decision | Financial KPIs | Practical example |
Inventory strategy (target level, coverage) | Working capital / Net working capital | 20% stock reduction at ASOS: £143 million in capital released |
| Logistics and Procurement Cost Management | A 5% reduction in logistics costs of €40 million: €2 million contribution to EBIT | |
OTIF monitoring (delivery capability) | Revenue protection / Customer retention | OTIF improved from 87% to 96%: a significant reduction in customer cancellations |
Resilience strategy (supplier network) | Cost of risk / Total shareholder return | Companies that actively manage resilience perform better in times of crisis |
Working capital is the company’s ‘fuel tank’. Every euro in stock is capital that SCM management either ties up or frees up through its inventory strategy. A decision to reduce safety stock frees up capital that the company can use for investment or debt repayment. Unilever also reported in 2024 that active inventory management (a reduction of several days’ stock) directly translated into margin improvements (Unilever Annual Report & Accounts 2024).
OTIF and delivery readiness: More than just a logistics KPI
Delivery performance levels or OTIF (On Time In Full) figures are the result of active SCM management decisions: What buffer strategies are defined? How accurate is the planning? How is supplier management conducted? OTIF is not a passive state of the supply chain, but the measurable result of management decisions.
Companies with active resilience management outperform their competitors during crises and in stable market phases in terms of total shareholder return, as major long-term studies show. For mapping SCM metrics to working capital figures, the PwC Working Capital Study 2023/24 recommends clear governance structures and cross-functional KPI ownership.
Supply chain management is therefore not a passive operational function, but an active control task. What distinguishes a company that actively manages its inventory from one that passively administers it? The former has a well-founded target range for each ABC/XYZ class. The latter relies on historical order quantities and hopes that logistics will fill the gaps. The financial contribution of this level of control is directly visible in working capital trends. Projects for inventory optimisation and working capital reduction are therefore a core business area for Abels & Kemmner.
How can the contribution of SCM to enterprise value be calculated?
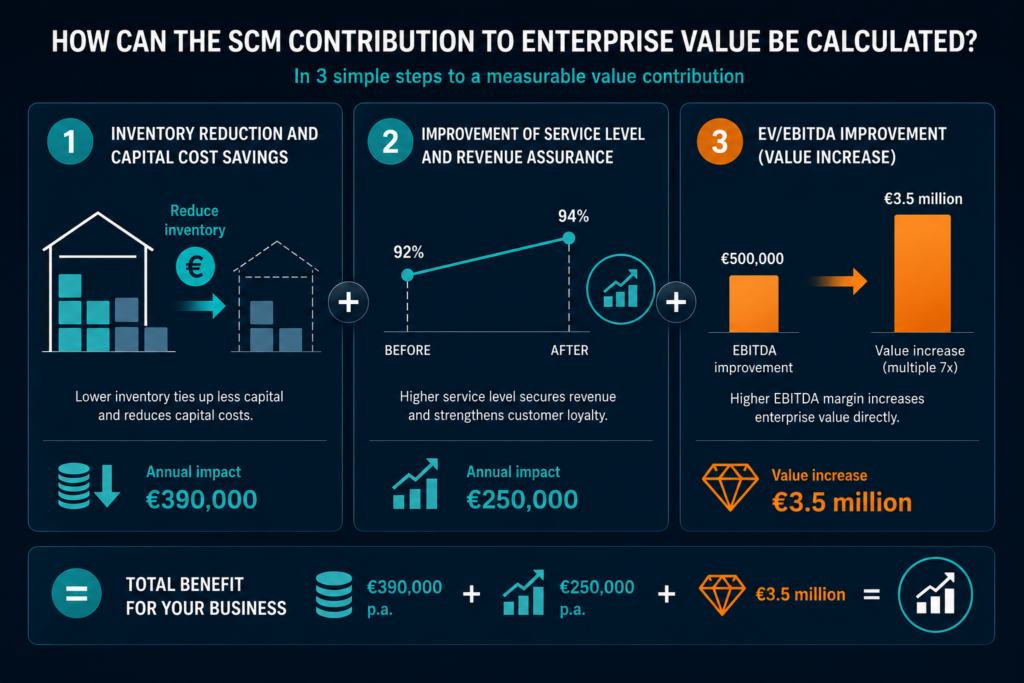
The financial contribution of supply chain management to enterprise value can be quantified in three steps: freeing up capital through inventory reduction, securing revenue by improving delivery reliability and OTIF, and increasing EBIT through cost reduction.
Step 1: Inventory reduction and savings on capital costs
Every euro of inventory released reduces the company’s capital costs. The formula: Inventory reduction (EUR) × WCS (warehouse holding cost rate) = annual savings on capital costs. According to our project evaluations, the WCS (warehouse holding cost rate) lies between 19% and 30%.
Specific calculation example: A company holds EUR 20 million in inventory. SCM management reduces inventory by 15% (EUR 3 million) through better replenishment decisions. With an inventory holding cost rate of just 13%, this equates to annual savings of EUR 390,000, which directly contribute to improved earnings. Added to this is a one-off cash inflow of EUR 3 million, which can be used for investment or debt repayment.
In A&K projects, companies typically achieve an inventory reduction of 20% or more.
Step 2: Improving delivery reliability and securing revenue
Improving delivery capability protects revenue that would otherwise have been lost due to cancellations, customers switching to competitors or contractual penalties. A case study by Crowe documents that a manufacturing company, following targeted inventory management, achieved a reduction of over USD 10 million in inventory, improved its working capital by USD 2 million and simultaneously increased its OTIF performance (Crowe Working Capital Case Study).
A conservative rule of thumb regarding the entire product portfolio of a stock-based manufacturer states: in the range between 90% and 95% delivery readiness, a 1% increase in delivery readiness yields a 0.5% increase in turnover.
Sample calculation: A medium-sized company with a turnover of 100 million, 20 million EUR in inventory and a value-weighted delivery readiness of 92% across its entire product portfolio improves this figure to 94%. This results in approximately 1 million EUR in additional turnover from improved delivery readiness through more skilful planning, and thus without increasing fixed costs. Even using a conservative estimate of a marginal profit of 25%, this results in a further €250,000 improvement in earnings.
Step 3: EV/EBITDA Valuation
An improved EBIT margin directly increases the enterprise value for medium-sized companies, given typical valuation multiples of 6–8x. An EBIT improvement of EUR 500,000 results in a value increase of EUR 3.5 million for the company at a multiple of 7x. SCM optimisations therefore not only contribute to current cash flow and earnings, but also to the value that a buyer would attribute to the company.
This relationship is particularly relevant for companies planning a sale, succession planning or raising capital. Inventory that is EUR 2 million too high not only reduces liquidity but also signals to a potential buyer that supply chain management requires optimisation. More active inventory management thus simultaneously improves liquidity, the operating margin and external valuation perception. All three factors are taken into account in the company valuation.
To implement this, most of our clients begin with a situation analysis that identifies the key levers for improving inventory and availability management. Once you are certain where the specific problems lie, you can immediately start addressing the relevant weaknesses.
Which operational levers generate the greatest value?
The operational levers of supply chain management can be divided into two categories: short-term, immediate measures with a high ROI (6–12 months) and structural changes with a long-term impact (12–24 months).
There is a world of difference between parameter optimisation and an ERP replacement, but not always in terms of the outcome. Many companies are too quick to opt for the most expensive solution.
What makes this approach so important? SCM projects often fail not because of the technology, but because of incorrect assumptions about the existing system. If you haven’t properly assessed the current situation, you’ll be optimising in the wrong place. And if you haven’t simulated the impact of a measure, you’ll only discover its actual effect once it’s in production – too late and too costly.
The specific process in four steps:
- Measure: Collect current data, determine KPI baselines, quantify efficiency gaps
- Simulate: Test scenarios in the digital twin, model value contributions, assess risks
- Prioritise: Rank measures according to quantified value contribution and implementation effort
- Implement: Implement iteratively, measure each measure against the modelled expectation
A digital transformation of a healthcare company documented by McKinsey, which included supply chain optimisation as a central component, increased the company’s value by approximately one billion USD. The methodology behind it was the same: measure, simulate, implement iteratively.
Our Digital Twin Simulation enables you to carry out precisely this process for your company. The simulation not only shows which measure delivers the highest value contribution, but also which risks are associated with each change. If you want to know where the greatest potential lies even before the simulation, you can start with an inventory potential analysis: a quick, data-driven initial assessment of inventory optimisation potential that can be carried out in just a few days.
In most companies, the planning parameters of existing ERP systems have evolved over time and have not been systematically reviewed for years.
Silvia Frankenne
Level 1: Quick levers (6–12 months)
MRP parameters are the ‘thermostat settings’ of the supply chain. Small changes to reorder points, safety stock levels and lead times alter the behaviour of the entire system. At Leuze electronic, optimising the MRP parameters achieved a 14% reduction in stock without the need to replace or implement a new ERP system.
Safety stock acts as the system’s shock absorber: it is necessary, but if incorrectly sized, it leads either to too much tied-up capital or to frequent supply bottlenecks. A thorough ABC/XYZ analysis and a review of the statistical basis for safety stock calculations are often the most effective first step. In practice, we regularly find that safety stocks have been calculated on the basis of outdated metrics or intuitive mark-ups, rather than on the basis of current demand dispersion and lead time variance.
Adjusting these parameters alone can reduce inventory levels by 8–15% without compromising service levels.
Silvia Frankenne
In fact, service levels often improve because resources are better focused on critical materials.
Level 2: Structural levers (12–24 months)
Structural inefficiencies often run deeper. Here is an example from our experience: at Fritz Driescher, we found that 69% of production capacity was being used for 10% of the parts. The remaining 90% of parts shared 31% of capacity. Through production segmentation—known in technical jargon as 80/20 levelling—lead times and, consequently, the required inventory levels could be drastically reduced.
Portfolio streamlining, supplier consolidation and capacity structure reviews are among the levers with the greatest long-term impact. Portfolio streamlining means: Which items justify the complexity costs they generate in the planning, procurement and warehousing processes? Items that contribute less than 0.1% to the contribution margin but account for 5% of planning effort destroy value. The decision to remove a product from the range is a management decision with a direct impact on fixed costs, storage costs and planning capacity. The Fraunhofer IPT Analysis 2024 identifies portfolio optimisation and digital process integration as the leading structural levers for manufacturing companies (Fraunhofer IPT ICNAP report 2024).
According to a study by Interos, supply chain disruptions cost companies with turnover in the range of USD 1 to 10 billion an average of USD 184 million per year (Resilience 2022: Interos Annual Global Supply Chain Report). Conservatively estimated, this corresponds to around 3.7% of turnover. Resilience management is therefore not a “nice-to-have”, but a quantifiable means of protecting value. We explain how planning processes structurally respond to disruptions in our article on Supply Chain Planning under Uncertainty.
How do you validate SCM investments before implementation?
Before a company invests in SCM optimisations, it should go through three phases: measurement (collecting current data and establishing a KPI baseline), simulation (identifying the right solutions and testing them without risk) and prioritisation (deciding based on quantified value contribution), before implementation begins.
The most common mistake: companies invest in large SCM projects without first measuring and simulating the expected value contribution. They rely on empirical data from other companies or on manufacturers’ promises. This leads to projects that, at best, deliver the expected impact; at worst, tie up significant capital without improving corporate value.
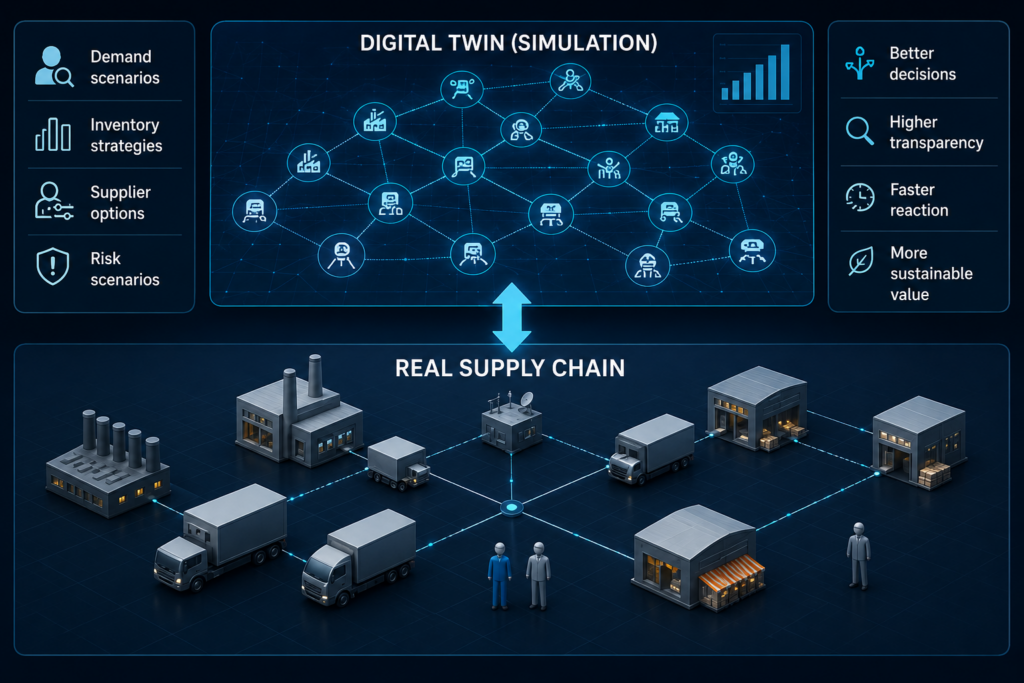
Our approach: we believe in “simulate before investing”. A digital twin of the supply chain serves as a wind tunnel in which scenarios can be tested risk-free before a single euro is spent. Fraunhofer IML describes the use of digital twins in logistics as a method for testing scenarios risk-free and making investment decisions based on facts (Fraunhofer IML on digital twin simulation in logistics).
What makes this approach so important? SCM projects often fail not because of the technology, but because of incorrect assumptions about the existing system. If you haven’t properly assessed the current situation, you’ll be optimising in the wrong place. And if you haven’t simulated the impact of a measure, you’ll only discover its actual effect once it reaches production – too late and too costly.
The specific process in four steps:
- Measure: Collect current data, determine KPI baselines, quantify efficiency gaps
- Simulate: Test scenarios in the digital twin, model value contributions, assess risks
- Prioritise: Rank measures according to quantified value contribution and implementation effort
- Implement: Implement iteratively, measure each measure against the modelled expectation
A digital transformation of a healthcare company documented by McKinsey, which included supply chain optimisation as a central component, increased the company’s value by around one billion USD. The methodology behind it was the same: measure, simulate, implement iteratively.
Our Digital Twin Simulation enables you to carry out precisely this process for your company. The simulation not only shows which measure delivers the highest value contribution, but also the risks associated with each change. If you want to know where the greatest potential lies even before the simulation, you can start with an inventory potential analysis: a quick, data-driven initial assessment of inventory optimisation potential that can be carried out in just a few days.
What does this mean for management and financial control?
To ensure that supply chain management can be actively managed as a value driver, senior management requires six key performance indicators (or groups thereof) in reporting to the executive board: Days of Supply, delivery readiness (value-weighted delivery readiness for finished goods held in stock and volume-weighted delivery readiness for purchased raw and semi-finished materials, plus OTIF at shipment level) , forecast accuracy, safety stock as a proportion of total stock, stock reduction potential (as a result of regular Digital Twin simulations), and ideally logistics costs as a proportion of turnover.
Which supply chain management KPIs do you report to your supervisory board? If the answer is ‘none’ or ‘only inventory costs’, you are managing your company’s value in this area blindly.
Board-level KPIs for active SCM value driver management:
- Days of Supply: How many days of production or revenue are tied up in inventory? –Value-weighted on-time delivery: The overall on-time delivery rate of a product portfolio, where the on-time delivery values of individual SKUs are weighted by their value. –Volume-weighted delivery readiness: The total delivery readiness of a product portfolio, where the delivery readiness values of individual materials are weighted by annual consumption volume.
- OTIF (On Time In Full): What proportion of customer orders does the company deliver in full and on time?
- Forecast accuracy: How precise are the demand forecasts? Poor forecasts generate both excess stock and stock shortages simultaneously. We explain separately how forecast quality acts as an SCM value driver.
- Inventory reduction potential: How much stock can be reduced within the company, relative to each individual material number, without compromising the required delivery readiness?
- Logistics costs as a percentage of turnover: All expenditure on transport, storage, handling, packaging and administration along the supply chain relative to the turnover generated.
A warning sign that deserves immediate attention: increasing stock coverage coupled with a decline in OTIF performance. This is not a logistics problem; it is a structural SCM management problem with direct implications for the balance sheet.
In 2024, Gartner introduced a quantitative risk management metric for the first time in its Supply Chain Top 25 methodology. In ‘Building a Resilient Tomorrow 2024’, the World Economic Forum recommends firmly embedding supply chain resilience into strategic corporate planning (World Economic Forum 2024). Both demonstrate that resilience, as a measurable value, has become an established part of external corporate assessment.
S&OP (Sales & Operations Planning) is the tool for integrating SCM decisions into the strategic planning cycle. There is a separate article on macroeconomic risks to the supply chain.
Request these key figures from your SCM management. Anyone wishing to know how much potential lies within their own supply chain can obtain an initial data-driven assessment of their current position within a few days using the inventory potential analysis developed by A&K.
TLDR: Key takeaways
- In most companies, supply chain management fails to realise 20–35% of its value-added potential. Treating SCM as a cost centre means leaving capital untapped, which is then missing from the balance sheet.
- Four financial metrics depend directly on SCM management decisions: working capital (inventory strategy), EBIT margin (cost management), revenue security (OTIF control) and risk costs (resilience strategy).
- Simple calculation: A 15% reduction in inventory, based on EUR 20 million in stock, frees up EUR 3 million in capital. With a 13% inventory turnover rate, this equates to an annual cost saving of EUR 390,000 plus a one-off cash inflow.
- Fastest levers: improving forecast quality and ** optimising planning parameters. At Leuze electronic: 14% reduction in inventory without replacing the ERP system.
- Before any investment: measure, simulate, then implement. The digital twin approach tests scenarios risk-free before real capital is deployed. Getting started: inventory potential analysis in just a few days.
FAQ – Frequently Asked Questions
How does supply chain management contribute to corporate value?
Supply chain management increases corporate value through four key drivers: (1) Reduction in working capital through active inventory management (typically: >20% savings in 80% of cases), (2) EBIT improvement through reduced logistics and procurement costs, (3) revenue protection through reliable on-time-in-full (OTIF) delivery management, (4) risk mitigation through resilient supply chain structures. Companies that actively manage all four levers demonstrably improve their free cash flow and corporate value.
What are the key KPIs for measuring the value contribution of SCM?
The key performance indicators for measuring the value contribution of SCM are: (1) Days of Supply, (2) OTIF (On Time In Full), (3) Value-weighted delivery readiness. (4) Volume-weighted delivery readiness, (5) Forecast accuracy, (6) Inventory reduction potential, and (7) Logistics costs as a percentage of turnover. These seven individual KPIs should ideally be included in all reports to senior management if SCM is to be managed as a strategic value driver.
How quickly do SCM optimisations yield measurable results?
Parameter optimisations in SCM often yield the first measurable results within 3–6 months. Inventory reductions of 10–15% are realistic within six months of implementing the measures, provided they are carried out consistently. Structural changes (portfolio, supplier strategy) take 12–24 months, but deliver sustainable value enhancement. Abels & Kemmner’s inventory potential analysis provides a data-driven overview of the potential for reduction within a few days.
How does on-time delivery (OTIF) affect turnover?
High delivery reliability (OTIF: On Time In Full) directly safeguards turnover: every missed delivery risks customer cancellations, the loss of follow-up orders and, in the long term, customer loyalty. Supply chain management actively manages OTIF through buffer strategies, accurate planning and supplier management. Companies that consistently manage OTIF not only protect their turnover but also strengthen their market position in the long term.