

Forecasting accuracy: Why it is overrated and which metrics really matter
A few months ago, a mechanical engineering firm based in southern Germany showed me its forecast report. The MAPE (which isn’t my preferred metric for forecasting accuracy) was below 18 per cent, significantly better than the industry average. The planning team was proud, and the management was satisfied.
Then we looked at the stock levels: 43 per cent of items were overstocked, item-specific availability for fast-moving stock was below 91 per cent, and storage costs had been rising for three quarters. Measuring and improving forecast accuracy without monitoring the actual targets is like polishing a machine to a high shine that is producing the wrong part.
Forecast accuracy is merely a means to an end, not an end in itself. The actual purpose of the supply chain is to keep stock levels low, reliably supply customers and minimise logistics costs. In over 200 supply chain projects, we at Abels & Kemmner have repeatedly observed this pattern: companies with excellent forecast figures but, at the same time, excessive stock levels and poor delivery performance.
This article explains why this is the case, which metrics really matter, and what tools are needed to actually measure and manage them.
Why is forecast accuracy not a suitable management KPI?
Forecast accuracy is a planning process metric: it measures the discrepancy between the demand forecast and actual demand within the planning system, not whether stock levels, delivery readiness or costs are correct.
The fallacy lies in a missing link in the causal chain. A forecast does not directly influence stock levels or delivery readiness. It does so only indirectly, via planning parameters: safety stock, lead times, reorder points, batch sizes, and safety stock limits. Improving forecast accuracy without simultaneously adjusting these parameters does nothing to change stock levels or delivery readiness. The forecast improves, but the supply chain remains the same.
A peer-reviewed study published in the Journal of Business Research (2020) examined how companies use forecast accuracy as a performance metric. The result: indicators of forecast accuracy are “not always strongly correlated with outcome measures such as inventory performance or customer service levels.” In qualitative interviews, the authors found that many planning departments use the MAPE value as a control variable, even though there is little empirical evidence of its impact on operational results. (Peer-reviewed study on forecast accuracy as a KPI)
Another symptom is evident in the Forecast Value Added analysis. The methodology developed by Michael Gilliland at SAS analyses which planning steps actually contribute to forecast quality. In a study of over 60,000 forecasts, 75 per cent of the statistical forecasts were manually overridden by planners. Many of these interventions did not improve accuracy; some even made it worse. (Forecast Value Added Methodology (SAS)) An enormous planning effort that is not reflected in the outcome KPIs.
Lokad provided a critical refinement of this methodology in 2024: whilst FVA shows which planning step does not improve forecast quality, it does not explain why statistical models underperform, nor does it answer whether the effort required to improve accuracy justifies its operational benefits. (Critical Evaluation of Forecast Value Added, Lokad 2024)
In summary: forecast accuracy is a process metric with a structural problem. It measures planning quality, not supply chain outcomes. And it provides no indication as to whether the effort involved in improving it generates a proportional benefit for inventory, delivery readiness or costs.
The following section shows which metrics close this gap. (Forecast accuracy – this metric doesn’t really get you anywhere)
Which supply chain metrics really matter
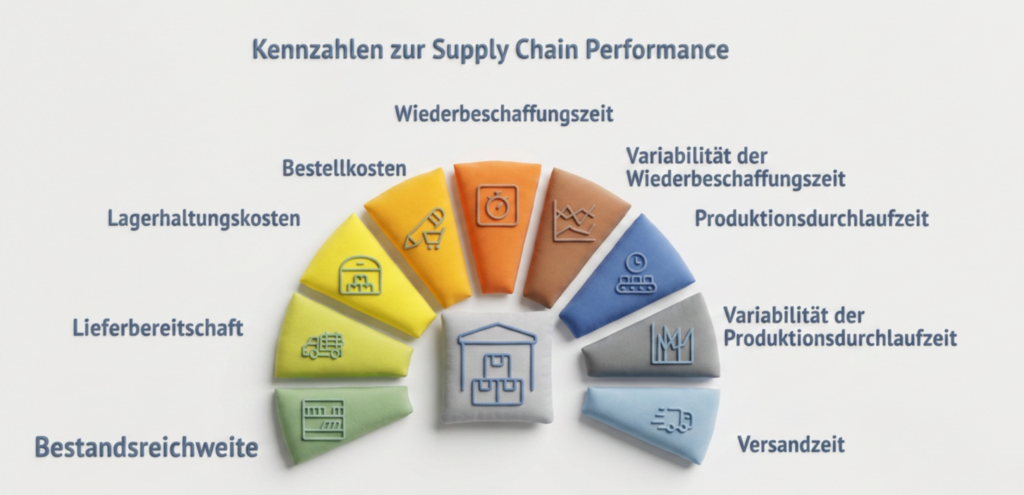
Metrics that directly reflect supply chain performance include, for example:
- Stock coverage,
- item-level delivery readiness at SKU level,
- aggregated monthly imputed holding costs (alternatively and in simplified terms: monthly stock values),
- aggregated imputed ordering costs (alternatively and simplified: number of orders per month),
- replenishment lead time and its variability,
- production lead time and its variability, as well as
These nine key performance indicators are not relevant simply because they appear in textbooks. They are relevant because they directly demonstrate whether the supply chain delivers what it is designed to: availability at an economically viable price and within a reasonable timeframe.
Stock coverage (in days) Stock coverage = average stock / average daily demand. It indicates how many days the current stock level can cover demand. Too high a coverage ties up capital; too low a coverage jeopardises delivery capability. Industry-standard target values outside the fast-moving consumer goods sector range from 15 to 45 days for finished goods, depending on the product type. In our projects at Abels & Kemmner, companies reduce their stock by at least 20% in 75% of cases when stock coverage is systematically managed using the correct planning parameters.
Item-level delivery performance (at SKU level)
Delivery performance per item = quantity delivered in full and on time across all customer orders per SKU × 100% / total quantity from all customer orders per SKU. Why item-level delivery performance rather than OTIF? Delivery performance can only be directly managed at the item level. OTIF metrics show the overall result of many individual delivery performance levels, but do not reveal where problems actually arise. A poor OTIF value says: “We are not delivering well enough.” Item-level delivery performance says: “These twelve items on line 4 and these three suppliers are the problem.” Only the second metric allows for operational control. OTIF metrics are important for describing the current situation, but too coarse for operational control; even though they are frequently recommended for this purpose. A company with a good OTIF score may nevertheless systematically fall short of the required delivery readiness for many key items, without this being apparent in the aggregated figure.
Monthly imputed stockholding costs
Formula: average monthly stock (in value units) × stockholding cost rate / 12. Industry-standard stockholding cost rates range between 19 and 30 per cent of the stock value per year, as shown by data from A&K project analyses. The imputed cost rate varies across different product segments but is usually rarely recalculated during the course of the year, whereas inventory levels change daily. Consequently, inventory holding costs also vary from month to month, even if the rate remains constant. Considering these imputed inventory holding costs rather than simply the inventory value provides an ongoing awareness of the costs associated with inventory. This key figure also highlights changes in cost structures, even if the total inventory remains largely unchanged due to the shifting of stock between product segments.
Monthly imputed ordering costs
Formula: Number of orders per month × cost per order. The cost per order is also an imputed cost, which varies across different product segments and delivery terms. As with inventory holding costs, these figures are generally only recalculated once or twice a year. The monthly number of orders, however, fluctuates with demand, seasonal patterns and replenishment decisions. Those who track this metric monthly can identify when batch size optimisations are taking effect and when order frequency is getting out of hand. As with holding costs, converting the number of orders into monthly imputed ordering costs keeps the resulting costs in mind and makes the cost structure and differentiation clearer than simply counting orders.
Replenishment lead time and its variability
Replenishment lead time is the time from when an order is placed to when the goods are received. It has a direct impact on the safety stock level. Its variability (standard deviation over the last 12 months) is the key control parameter for safety lead times or safety stock levels on the procurement side.
(On the procurement side, however, it makes more economic sense to work with lead times rather than safety stock: lead times achieve the same delivery reliability with less capital tied up)
Production lead time and its variability (in manufacturing companies)
Like lead time, production lead time and its variability have a direct impact on supply chain performance and determine its internal responsiveness. Significant fluctuations in production lead times also indicate poor capacity levelling.
Dispatch time
Dispatch time refers to the period from receipt of the customer order to dispatch of the delivery to the customer. From the customer’s perspective, it represents a key aspect of the perceived delivery reliability.
The common denominator of these nine KPIs is that they directly describe the overall performance of the supply chain, are influenced by all operational decisions, and are causally linked to the company’s objectives. This does not apply to forecast accuracy as a control variable
How a digital twin makes KPIs manageable
To optimise a supply chain’s performance in terms of stock levels, delivery readiness and costs, it must be possible to identify in advance how planned changes – such as improved forecast accuracy, adjusted planning parameters or altered delivery times – will actually affect these key performance indicators. This is precisely what a digital twin enables: it shows the effects of planned measures on stock levels, delivery readiness and costs before they are implemented in the real supply chain. Crucially, such a digital twin does not merely extrapolate values into the future, but incorporates empirical findings and real-world correlations from the past into its calculations. This is the key difference from a BI dashboard, which only shows what has happened. The twin shows what will happen as a result of a specific decision.
The digital twin incorporates forecast inputs and complete network parameters: lead times, capacities, order quantities, safety stock. It then simulates how forecast deviations translate into stock levels, delivery readiness and costs. If procurement lead time variability increases by two weeks, the twin immediately shows which safety lead times need to be adjusted and what effect this has on stock levels. No trial and error in the real supply chain with a high risk of delivery failures or excess stock.
A digital twin effectively acts as a wind tunnel for a supply chain: changes to the design are tested virtually before real assets are put at risk. You can read about how this works here, for example.
With a digital twin of the planning processes, it is possible to identify which items’ forecast improvements actually have a significant impact on stock levels and delivery readiness.

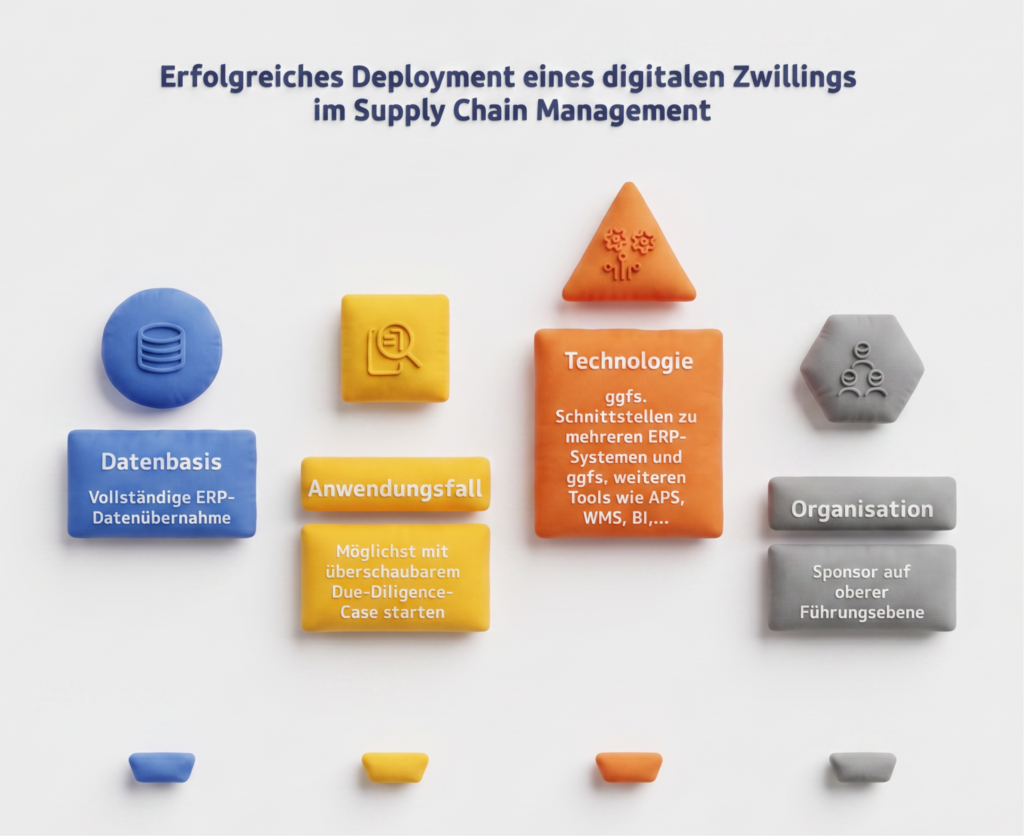
What are the prerequisites for a digital twin?
What do you need to prepare before a digital twin becomes operational?
The first and most important decision concerns the data foundation. Based on our implementation experience, the data foundation should, as far as possible, be transferred in full from the ERP system right from the start. Product master data, transaction data (inventory, orders, goods movements), historical and current procurement lead times, production lead times and capacity data form the foundation. Data must be prepared, harmonised and modelled. This is a one-off effort. Adding individual data sets retrospectively is considerably more expensive than a comprehensive initial transfer.
This should be distinguished from the question of the first use case. A broad data set does not mean that all strategic decisions should be based on the digital twin immediately. It makes more sense to start with a manageable due diligence case: simulating inventory optimisation for a product group, testing the effect of a change in safety stock levels for the ten most critical suppliers, or calculating the consequences of supplier consolidation. Small, clearly defined questions deliver results quickly and build internal confidence in the tool before strategically larger decisions are based on it.
Technically, a digital twin requires interfaces to the ERP system and, depending on the task, to WMS, TMS and APS systems.
From an organisational perspective, having a sponsor at senior management level helps with the introduction and application of a digital twin in supply chain planning and supply chain management, ensuring that simulation results are translated into operational decisions. A digital twin that produces insights which nobody uses remains an intellectual exercise with no operational impact.
The global market for digital twins in supply chain management is growing by an average of around 12 per cent annually and was worth approximately 2.5 billion US dollars in 2022, as documented by a market survey from Grand View Research. This signals falling entry costs and increasing system maturity. For medium-sized businesses, this means that setting up a digital twin is no longer a major project that only large corporations can afford.
Key takeaway
- Forecast accuracy is a planning process metric. Studies show that it does not correlate reliably with stock levels, delivery readiness or costs.
- Nine directly controllable outcome KPIs that provide a good description of supply chain performance are: stock coverage, item-level delivery readiness (SKU level), monthly holding costs, monthly ordering costs, lead time and variability, production lead time and variability, and dispatch time.
- Forecast improvements only take effect if planning parameters and safety stock levels are adjusted at the same time. Otherwise, they improve stock levels and delivery readiness less than is often hoped for.
- Digital twins make it possible to see the causal link between forecast deviations and their impact on stock levels and costs (for ROI benchmarks, see the section ‘Digital Twin’).
- When introducing digital twins, the following applies: use the broadest possible ERP data set from the outset, but start with manageable due diligence cases.
FAQ – Frequently Asked Questions
What measures forecasting accuracy, and what does not?
Forecast accuracy measures the discrepancy between the demand forecast and actual demand within the planning system; it does not assess whether stock levels, delivery readiness or costs are correct. Supply chain outcomes are determined by the planning parameters, which use the forecast merely as an input variable. High forecast accuracy therefore only leads to better outcomes if the parameters are adjusted at the same time. This missing step explains why many forecast optimisation projects fail to achieve measurable inventory effects.
Which supply chain KPIs are more important than forecast accuracy?
The directly controllable supply chain outcome KPIs are: (1) stock coverage in days, (2) item-specific delivery readiness per SKU, (3) monthly imputed stockholding costs, (4) monthly imputed ordering costs, (5+6) replenishment lead time and its variability, (7+8) production lead time and its variability, (9) dispatch time from order receipt to dispatch. These nine metrics can be measured monthly, are directly influenced by operational decisions, and are causally linked to stock levels and delivery readiness.
How do you accurately measure stock availability at SKU level?
Delivery readiness at SKU level measures the quantity of each item that was delivered on time from available stock, relative to the total customer order quantity during the period under review. Only this item-specific measurement enables operational control, as it shows which specific items are driving performance. Aggregated OTIF figures show the overall result without identifying the underlying causes.
How does a digital twin help with KPI measurement?
A digital twin in the supply chain simulates how changes to forecasts, lead times or planning parameters affect stock coverage, delivery readiness and costs before these changes are actually implemented. This transforms KPI measurement from retrospective analysis into proactive management. Modern twins also enable the daily automatic adjustment of planning parameters, which is what distinguishes an analytical dashboard from a genuine operational control tool.