

Empirically Simulating Planning Strategies
When we evaluate planning and replenishment strategies in consulting projects, discussing individual parameters is rarely enough. Lot sizes, safety stocks, forecasting methods and replenishment lead times interact. That is why we use a digital twin powered by DISKOVER. Using actual historical data, the simulation shows how alternative settings would have performed under the same demand fluctuations. In a typical consulting project, DISKOVER initially serves as a temporary analytical tool. We deliver findings and recommendations. Whether the client subsequently uses DISKOVER for further analyses or operational planning is a separate decision made at the end of the project.
The Digital Twin as an Empirical Testing Environment
What the digital twin represents
Many planning questions initially sound straightforward. Should safety stock be increased? Would a smaller lot size be more economical? Does the forecasting method in use still suit the demand pattern? Yet each of these decisions affects a network of interdependencies involving inventory, orders, replenishment lead times, demand patterns and costs. Anyone focusing on just one variable will often only discover the side effects of a change once it has been implemented in day-to-day operations.
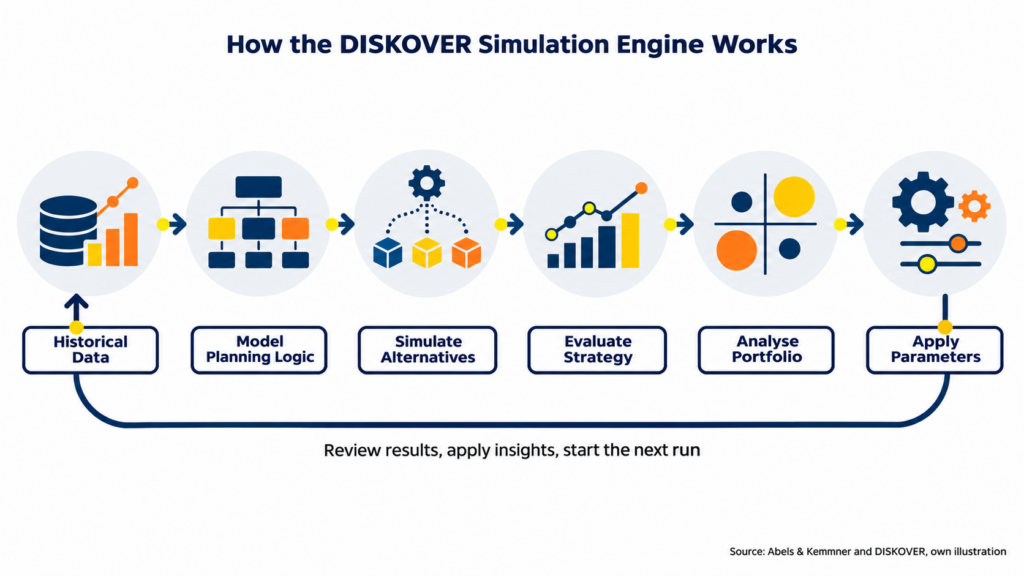
In our consulting projects, we therefore create a digital representation of the relevant planning and replenishment logic. DISKOVER draws on data from the ERP system and, where necessary, additional data sources. The digital twin encompasses historical demand as well as the rules and parameters used to generate forecasts, order proposals or production orders. Fraunhofer IMWS generally defines a digital twin as a virtual representation of a physical object, process or system. DISKOVER’s Simulation Engine applies this principle to empirically examine the effects of alternative planning and control approaches.
The crucial step is historical simulation. DISKOVER takes planning back to an earlier point in time and calculates forward using the information available at that time. The simulated inventory is then drawn down by the demand that actually occurred. Alternative methods are thus compared under the same historical fluctuations.
Historical Simulation Instead of Idealised Projections
This approach differs from a simple extrapolation. Instead of projecting an idealised inventory trajectory into the future, the simulation subjects a planning strategy to a historical stress test.
The digital twin remains a model designed for a specific purpose. It represents the relationships relevant to the question at hand, rather than every detail of the company. In a consulting project, we therefore first clarify which decision the analysis is intended to support. Only then do we define the scope of the data, the time period and the alternatives to be examined.
The Consulting Brief Determines the Scope of the Model
This sequence prevents the simulation from becoming a mere computational exercise. In many consulting projects, the work starts one step earlier: we first need to identify the actual causes of inventory or product availability problems. Companies usually have plausible explanations for these issues. However, analysis repeatedly shows that some assumptions are incorrect or explain only part of the observed effect. The digital twin helps test these hypotheses against observable system behaviour.
Before the first simulation run, we therefore focus on four questions: Which items or item groups are in scope? Which performance measures should be improved? Which conditions can be changed? And how will we subsequently determine whether an alternative is viable in practice? The answers define the task for the digital twin.
Understanding the current situation is equally important. A simulation needs a clearly defined baseline. This includes the methods actually in use, the parameters applied and any known special rules. Much of this information is already captured in the data imported from the ERP system. Existing organisational processes provide further input for the analysis. Only once this baseline has been represented credibly can we assess the additional value a new strategy could deliver.
The Optimisation Strategy Translates Business Objectives into Planning Priorities
The company determines how alternatives are evaluated
A simulation needs a clear basis for evaluation. A company may aim to keep inventory low while maintaining a specified service level. In another situation, forecast accuracy or total costs may take priority. DISKOVER allows these objectives to be prioritised and combined into a company-specific optimisation strategy.
This is a key strength of the simulation functionality. The software does not impose a universal logistics strategy on the company. Management and the relevant business functions determine which performance measures matter and the order in which they are evaluated. The simulation translates these priorities into a transparent comparison of alternatives.
Typical combinations of objectives include:
Forecast accuracy, service level and inventory;
Service level and the lowest possible inventory;
Service level and total costs; or
Total costs, service level and inventory.
A simple example illustrates the implications. Two alternatives achieve a similar service level. The first requires higher average inventory but generates fewer orders. The second ties up less capital but results in more frequent orders. Which alternative is more suitable depends on the cost structure, procurement conditions and business model. The optimisation strategy makes this preference explicit and identifies the better alternative under the specified objectives.
Priorities Make Trade-offs Visible
In our consulting work, we therefore discuss priorities before comparing a broad range of alternatives. A required service level must reflect market requirements. Cost targets need reliable cost data. DISKOVER provides the computational power; the company defines the objectives.
The order of the performance measures is more than a matter of presentation. It determines which alternative is identified as the most suitable. If several simulated solutions perform equally well against the first criterion, the next criterion determines the outcome. If no alternative fully meets a specified target, DISKOVER identifies the one that comes closest and performs best against the subsequent criteria.
This turns a technical calculation into a strategic comparison. The company can see which settings perform best in the calculations. At the same time, it becomes clear how these settings align with its inventory and delivery service strategy. For operational use, it remains essential that the objectives and evaluation criteria match the actual planning task.
Interactive Simulation Reveals Interdependencies
Typical Questions at Item Level
Before applying a strategy to an entire product range, we often explore selected items interactively. An individual item makes cause and effect tangible. Together with replenishment planners and the planning team, the consultant can trace how a change in lot size, replenishment lead time or forecasting method affects inventory over time.
Typical questions include:
How does inventory change with a different lot size or minimum order quantity?
What safety stock is needed to achieve the target service level?
What are the effects of longer replenishment lead times or different calendars?
How do different forecasting and replenishment methods interact?
DISKOVER compares historical inventory trajectories with those projected under current planning settings and simulated alternatives. This reveals when inventory builds up, when actual demand depletes it, and where a chosen strategy would have caused shortages or unnecessarily high inventory. The graphical presentation helps explain the figures in their operational context. It does not replace interpretation.
Graphical Comparisons Help Identify the Causes
For us, interactive simulation is therefore more than a software interface. It provides a shared workspace for consultants and users. Master data anomalies, implausible assumptions and distinctive demand patterns are easier to spot at item level. At the same time, the project team develops a shared understanding of the mechanisms that actually drive planning.
The sample items are selected deliberately. We usually examine items with typical demand patterns, economically significant items and unusual cases. A standard item with regular consumption requires different strategies from a spare part with sporadic demand. Together, these cases show whether a strategy performs well only under favourable conditions or can handle different demand patterns.
Seemingly surprising results are also useful. If inventory increases despite a smaller lot size, another setting may be outweighing the effect. If forecast accuracy improves while the service level barely changes, replenishment lead time and the safety stock settings warrant closer examination. The discussion thus moves from the numerical result to its underlying cause.
Testing an alternative does not yet change operational planning. Only once a result appears plausible and aligns with the chosen strategy is a deliberate update to the corresponding master data considered. This separation allows questions to be resolved without using day-to-day operations as a testing ground.
Batch Simulation Tests Strategies Across the Portfolio
From understanding individual cases to broader testing
Individual analyses explain interdependencies, but they are not sufficient for a product range comprising hundreds or thousands of items. Batch simulation therefore extends the same empirical approach to a larger set of items. Items can be selected according to business criteria, while a simulation configuration defines which types of alternatives are compared.
In consulting projects, we use test rule sets for this purpose. They specify how items with particular characteristics should be treated, without changing the operational parameter settings mirrored in DISKOVER during testing. This makes it possible, for example, to examine how a revised inventory strategy affects different demand classes or which item groups require different forecasting and replenishment logic.
The precise technical setup depends on the individual project. For understanding the approach, one principle is sufficient: each relevant item is tested under comparable conditions, after which DISKOVER evaluates the results according to the specified optimisation strategy. Promising approaches can then be explored further.
Portfolio Results and Exceptions Belong Together
In practice, we deliberately manage the transition from interactive simulation to batch simulation. First, the planning question must be understood using a few selected items. We then check whether the required data is available at a comparable level of quality across the portfolio. Only then is a broader simulation run worthwhile. This approach also makes subsequent interpretation easier, as familiar cause-and-effect relationships can be recognised in the aggregated results.
A batch run is therefore not a black box that simply produces a list of new parameters. It is a structured comparison across many items. The portfolio view reveals how often a strategy works, where it reaches its limits and which item groups require different treatment. This gives consultants and the relevant business functions a picture encompassing both the overall impact and the exceptions.
Interpreting Results from Item to Portfolio Level
More Than a Ranking of Alternatives
A simulation provides more than a ranking of alternatives. At item level, it shows how methods and parameters affect the measures relevant to planning. These include the service level achieved, inventory quantities and values, shortages, and the number of planned orders or receipts generated.
Where reliable cost data is maintained, ordering and inventory holding costs can also be included in the evaluation. Forecasts can be assessed using error metrics such as mean absolute error (MAE) and bias. Bias indicates whether a forecast tends to overestimate or underestimate demand over a given period. These metrics are useful, but should not be interpreted in isolation. A better forecast does not automatically reduce inventory if lot sizes, replenishment lead times or safety stock logic counteract the improvement.
Pivot and portfolio analyses then aggregate the results by product range, plant, planner group or other structures. A drill-down traces an unusual aggregate value back to the items responsible. This preserves the link between the management view and individual cases.
From Aggregated Results Back to Individual Items
The Fraunhofer Institute for Material Flow and Logistics describes supply chain simulation as a means of making bottlenecks, inventory and alternative scenarios transparent (Fraunhofer IML: Supply Chain Simulation). In a consulting project, however, value only emerges when the results are translated into concrete planning decisions.
This translation begins by questioning the results. Does the selected alternative reflect the expected cause-and-effect relationship? Is an inventory effect concentrated in a few high-value items, or is it spread broadly across the portfolio? Are targets met only in aggregate, while individual items deviate significantly? Such questions prevent a good portfolio result from concealing problematic individual cases.
Conversely, a single outlier should not discredit an otherwise suitable strategy. The drill-down reveals whether an exception stems from the available data, a particular procurement condition or an unsuitable branch of the rule set. This allows us to distinguish between a necessary adjustment to the strategy and a justified exception requiring separate treatment.
From Simulation to Better Planning Settings
Consulting deliverables or continued use of DISKOVER
At the end of a standalone consulting project, we deliver the analytical findings and our recommendations. The article Digital Twin in the Supply Chain provides an introduction to this connection between data, simulation and operational planning. The deliverables often also include a replenishment rule set, which can be understood as a structured replenishment planning handbook. A defining feature of such a handbook is its dynamic nature. It specifies in detail how parameter settings should be adjusted when particular item characteristics change. The company decides which proposed changes to implement in its existing processes and systems. In this case, our use of DISKOVER as an analytical tool ends with the project. The client therefore receives a sound basis for decision-making without needing to use DISKOVER permanently to implement the recommendations.
Alternatively, the client can choose to use DISKOVER independently after the consulting project. Options range from further case-specific analyses and automated master data maintenance using the replenishment rule set developed during the project to regular, calendar-based evaluations and operational support for forecasting, S&OP, replenishment planning, capacity planning or detailed production scheduling. The appropriate scope depends on the objectives, data quality, organisation and desired level of automation.
Prerequisites and Limitations
Data Quality Is Part of the Assessment
The quality of an empirical simulation starts with the data. Historical demand, transaction data and master data must adequately reflect actual planning conditions. Particular attention should be paid to replenishment lead times, calendars, lot sizes, minimum quantities, safety lead times, customer orders, reservations and goods issues. Simulation does not correct errors in this data. At best, it makes them visible.
The historical data must also suit the question being examined. New items, structural breaks or lasting changes in market conditions limit the relevance of past demand patterns. Cost-based evaluations additionally require reliable inventory holding cost rates and fixed costs per order or production lot. If these inputs are missing, the evaluation should be restricted to measures that can be calculated reliably.
In our projects, we therefore check more than whether data fields have been populated. The values must also make sense in their operational context. A replenishment lead time may be recorded yet still be outdated. Historical demand may include exceptional effects that are no longer relevant to the future strategy. A&K’s logistics controlling and data quality services explain why assessing data in its operational context and understanding performance measures go hand in hand.
Historical Simulation Is No Guarantee of Future Performance
The main limitation lies in the nature of historical simulation itself. It shows how a planning strategy would have performed under the actual fluctuations of the period examined. This does not guarantee identical performance in the future. The method’s strength lies in a fair, data-based comparison of alternatives. A&K’s description of simulation using a digital twin explains how we combine this perspective with process analysis and expert interpretation.
This limitation is precisely what makes the findings useful. A simulation does not need to predict the future to distinguish a poor planning strategy from a more suitable one. It must make clear which data and assumptions underpin the comparison. Companies can then base their decisions on observable effects rather than assumptions.
Key Takeaways
The digital twin in DISKOVER models the relevant planning and replenishment logic using real company data.
Historical simulation compares alternative methods under the same historical demand fluctuations.
Through the optimisation strategy, the company defines the objectives and priorities that guide the evaluation.
Interactive simulation builds understanding at item level, while batch simulation extends testing across the portfolio.
In a consulting project, DISKOVER initially provides findings and recommendations; subsequent analytical or operational use by the client is a separate option.
FAQ – Frequently Asked Questions
How does a digital twin differ from a traditional forecast?
A forecast estimates future demand. A digital twin also incorporates planning and replenishment logic, showing what inventory levels, orders and shortages would have resulted from a chosen strategy.
Why does DISKOVER use actual historical data?
Actual demand patterns capture fluctuations, seasonal patterns and exceptional situations that an idealised calculation would miss. The empirical approach tests all alternatives under the same historical conditions.
What is the difference between interactive simulation and batch simulation?
Interactive simulation examines a single item, making cause and effect easy to understand. Batch simulation automates the comparison across a selected set of items and enables portfolio-level analysis.
How does a company define its optimisation strategy?
The company defines the relevant performance measures and their priorities. Depending on the business model, the focus may be on forecast accuracy, service level, inventory or total costs.
Are selected parameters automatically transferred to the ERP system?
Simulation and any subsequent adoption of parameters in DISKOVER are separate from transferring those parameters back to the ERP system of record. Transferring them back requires a suitably configured integration. This is not essential, but it is the usual approach.
Does DISKOVER remain available to the client after a consulting project?
Not necessarily. In a standalone consulting project, A&K uses DISKOVER temporarily for analysis and simulation, then delivers the findings and recommendations. The client can subsequently make a separate decision on whether to use DISKOVER for further analyses or as an operational planning tool.