

From reactive to proactive supply chain management
A few years ago, we took on a project at a medium-sized manufacturing company. Every day, unplanned bottlenecks were causing around 12 per cent of production time to be lost. Schedulers spent more than half their working hours putting out fires rather than planning. After six months of systematic parameter optimisation, the ‘firefighting rate’ fell by 50 per cent, stock levels dropped by 18 per cent, and the planning workload for the dispatchers was reduced by 40 per cent. No new ERP system, no major transformation programme.
Proactive supply chain management refers to a planning approach in which companies identify and manage disruptions before they escalate. In more than 200 projects spanning 30 years, we at Abels & Kemmner have observed that many supply chains are structurally managed in a reactive manner, even though the tools for proactive management have long been available. This article explains how to recognise reactive mode, which specific levers can help break the cycle, and what a realistic transformation roadmap looks like.
How can you recognise a reactive supply chain?
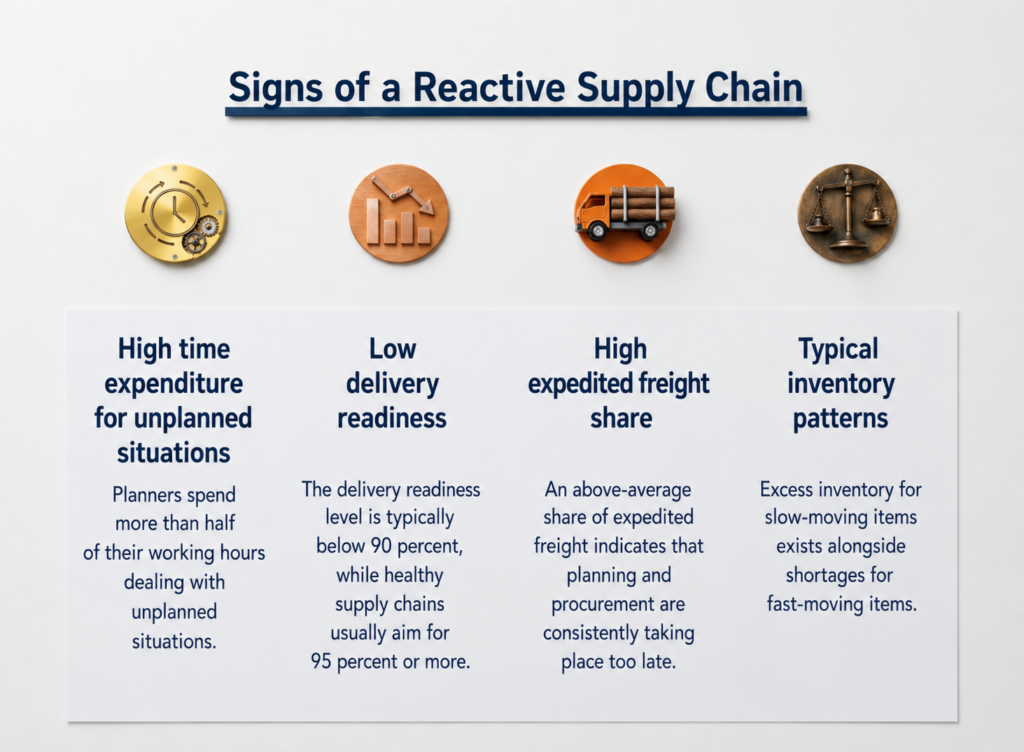
If planners spend more than half their working time dealing with unplanned situations, the supply chain is structurally reactive. This metric is easier to measure than many people think: for one week, categorise the proportion of planners’ activities that consist of routine scheduling and those that involve crisis response.
Three measurable indicators reliably signal a reactive mode. The on-time delivery rate is below 90 per cent, whereas healthy supply chains typically aim for 95 per cent or more – and in the automotive sector, as high as 97 to 99 per cent. According to a Service Council survey (2023), 58 per cent of the executives surveyed cite on-time delivery as the most important indicator of a company’s health. Anyone who fails to measure this figure reliably is steering blind.
A second indicator is an above-average proportion of express freight. Express shipments indicate that planning and procurement are consistently taking place too late.
The third signal is a typical stock pattern: excess stock of slow-moving items, whilst at the same time there are shortages of fast-moving items. This is no coincidence, but a systemic signal.
According to a study by the European Investment Bank on supply chain disruptions, a significant proportion of European companies have been affected by inventory build-up and adjustment costs resulting from disruptions in recent years (EIB study “Navigating supply chain disruptions”, 2024). The Allianz Risk Barometer 2024 once again confirmed that business interruptions, including supply chain constraints, are the greatest risk to companies. What these figures have in common is that they describe the consequences of reactive management, which are directly reflected in balance sheets.
A simple rule of thumb for self-assessment is: a delivery readiness rate below 90 per cent, a proportion of express freight above the industry average, and more than a third of planning time spent on unplanned interventions. Anyone who recognises two of these three signs is deeply entrenched in that perpetual fire shift where putting out sparks never ends because the source of ignition has not been eliminated.
What really sets proactive supply chain management apart?
Proactive supply chain management differs from the reactive approach in four structural dimensions: planning horizon, data basis, decision-making logic and the allocation of roles amongst planners.
Dimension | Reaktive SC | Proaktive SC |
Planning horizon | On a daily basis, response to bottlenecks | Weeks to months, early warning system |
Data base | Historical ERP data | Historical ERP data, real-time data and external signals |
Decision-making logic | Full processing of all items | Exception management by priority |
Allocation of roles | Planners as firefighters | Planners as decision-makers in exceptional cases |
The key difference lies in the planning approach: a reactive supply chain attempts to process all items simultaneously. A proactive supply chain uses leading KPIs – that is, early warning indicators – which highlight problems before they escalate. Lagging KPIs, such as delivery readiness or stock coverage, measure what has already happened. Leading KPIs, such as supplier lead time variance or forecast stock-outs, on the other hand, signal what is on the horizon.
Proactive supply chains use real-time data and predictive analytics to identify disruptions at an early stage. They are managed through automated exception handling and scenario simulations. APQC benchmarks on forecast quality show that companies with structured forecasting processes achieve measurably higher on-time delivery rates than the average.
A planner in a proactive supply chain is like a pilot at the helm: they know the course, spot obstacles early on and issue corrective signals before the ship veers off course. Their reactive counterpart reacts to each wave individually. The article on planning under uncertainty illustrates how these structural differences play out in real-world planning conditions, using specific planning scenarios as examples.
Which levers drive the fastest progress?
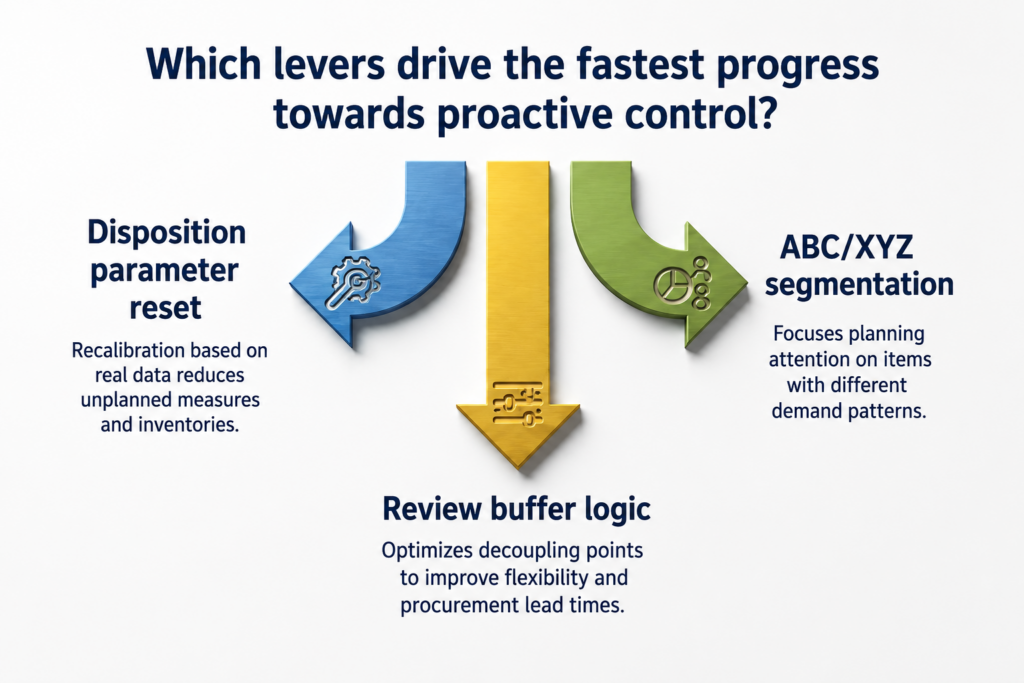
The project mentioned in the introduction illustrates a point that many companies underestimate: the quickest route to proactive control starts with the planning parameters. Safety stock levels, lead times and batch sizes determine how the system behaves. In many companies, these are not systematically reviewed for years. They are like a voltage regulator on a motor: A slight miscalibration drastically alters behaviour without the error being visible on the surface.
Lever 1: Resetting planning parameters. A thorough parameter audit regularly reveals that safety stock levels are set either too high (capital tied up) or too low (missing parts), because they were set based on gut feeling or during the one-off ERP go-live. Recalibration based on real lead times and actual fluctuations in demand is the intervention with the fastest ROI. In projects carried out by Abels & Kemmner, the proportion of unplanned actions was reduced by 50 per cent within six months, solely through this recalibration without any system change. Typical stock reductions range between 15 and 30 per cent.
Lever 2: ABC/XYZ segmentation and planning focus. Not all items deserve the same level of planning attention. A-items with stable demand can largely be planned automatically. C-items with volatile demand require different parameters to C-items with stable demand. Without this segmentation, planners treat all items equally, leading to a systematic misallocation of planning time.
Lever 3: Review buffer logic and decoupling points. At what point in the value chain do you decouple forecasting from ordering? Many companies have never explicitly made this decision. The result is either commitments made too early, leading to a loss of flexibility, or procurement that is too late.
In a recent analysis, Oliver Wyman identifies four tried-and-tested levers for inventory optimisation (2024), which include ABC variant reduction, buffer logic and prioritisation. Furthermore, typical holding costs and optimisation potential (ScottMadden, 2024) confirm the range of 15 to 30 per cent as a realistic target corridor for focused programmes.
This explains why forecast accuracy alone is not enough: what matters are the planning parameters that govern system behaviour, not the forecast value as an end in itself.
How is the planning organisation changing as it moves towards proactive management?
Most companies we encounter in our projects invest in technology before processes and responsibilities have been clarified. This is a structural flaw with predictable consequences. A new APS system introduced into a planning department organised on a reactive basis produces reactive results, accompanied by higher licence costs.
McKinsey research shows that only 30 per cent of executives have a comprehensive picture of their supply chain risks. Many address risks reactively. This is not a lack of knowledge, but a structural problem: if it is unclear who makes decisions in the event of an exception, ‘firefighting mode’ ensues once again, despite modern systems.
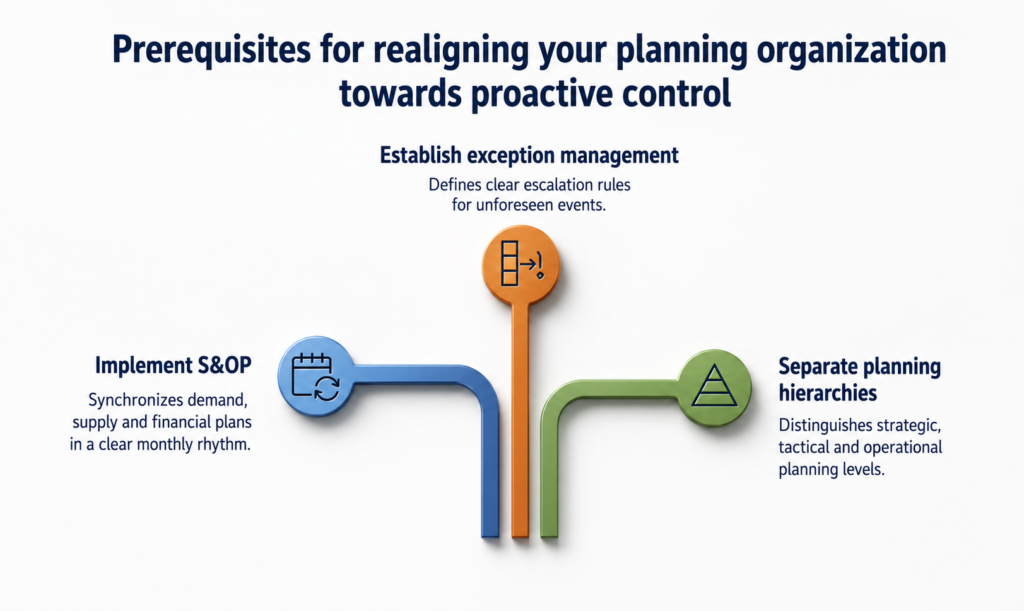
Three organisational prerequisites lay the foundation.
Firstly, a functioning Sales & Operations Planning (S&OP) system is required. According to the ASCM definition of the S&OP process, S&OP is a process for synchronising demand, supply and corporate planning, linking strategic objectives with day-to-day operations. In practice, there is often no clear monthly rhythm: sales, production and procurement plan separately and only synchronise when a bottleneck escalates. Viewing S&OP as a monthly navigation log transforms the planning culture.
Secondly, exception management must be established as a principle. Who makes the decision as soon as there is a risk of an A-grade item running out? Who reviews supplier deviations above a defined threshold? Without explicit escalation rules, each planner handles every exception individually, leading to inconsistent decisions.
Thirdly, planning hierarchies must be clearly separated: strategic planning (12 months and longer), tactical planning (1 to 12 months) and operational scheduling (days to weeks). Many supply chains mix these levels, which results in operational firefighting taking precedence over strategic planning time. The linked article clearly describes how S&OP functions as the backbone of planning in practice.
.
Which technologies enable predictive supply chain management?
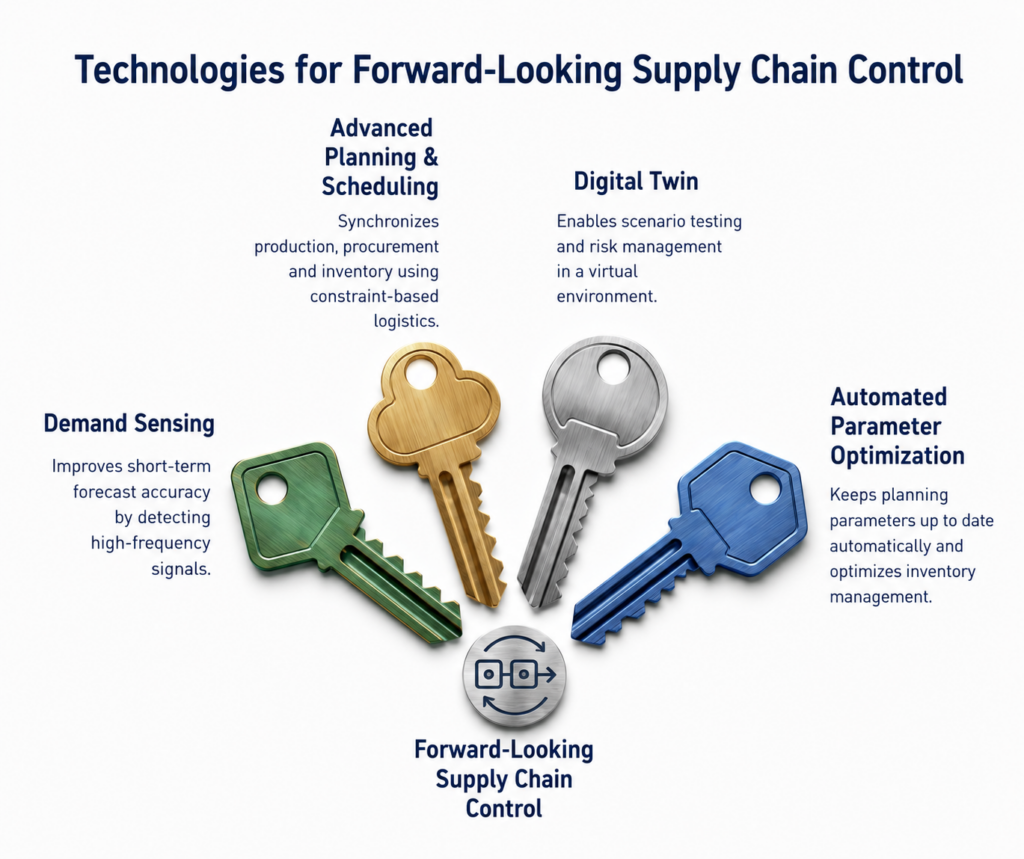
Four technologies form the foundation of predictive supply chain management: demand sensing, advanced planning and scheduling (APS), the digital twin and automated parameterisation.
Demand sensing improves short-term forecasting accuracy through high-frequency signals: order patterns, POS data and external indicators. According to a Kearney study on demand sensing (2023), typical improvements range from 5 to 20 per cent compared with traditional forecasting. The effect is particularly pronounced for the first 1 to 4 weeks of the planning horizon, where traditional forecasting models are at their least reliable. Demand sensing is therefore particularly useful for fast-moving consumer goods and items with short replenishment lead times.
APS systems synchronise production, procurement and warehousing using constraint-based logic. They replace the sequential planning approach of traditional ERP systems with simultaneous optimisation. Only around 10 per cent of companies have fully implemented APS, which explains the competitive advantage enjoyed by early adopters. Typical implementation times range from 4 to 9 months for a piloted roll-out.
The digital twin acts as a wind tunnel for the supply chain: it enables companies to run through scenarios – such as changes of supplier, fluctuations in demand or capacity bottlenecks – before they have any real-world consequences. Accenture describes practical applications of the digital twin, such as risk-free scenario testing for complex networks. Abels & Kemmner utilises this method in its projects. Our subsidiary SCT offers DISKOVER, an APS system and supply chain control tower with an integrated digital twin.
Automated parameterisation bridges the gap left by manual maintenance. Manually keeping planning parameters up to date is unfeasible when dealing with thousands of SKUs. Modern APS systems, such as the aforementioned DISKOVER, enable automated parameterisation that readjusts safety stock levels, order quantities and replenishment times on a daily basis using real data.
One key prerequisite applies equally to all four technologies: data quality takes precedence over investment in technology. Poor ERP data, unmanaged master data and incorrect delivery time specifications produce results that appear reliable but do not provide a useful foundation. Technology merely amplifies what it finds.
How do you measure the progress of the transformation?
What gets measured gets managed. But which key performance indicators (KPIs) really distinguish between reactive and proactive supply chain management?
Progress in the transformation can be tracked using three groups of KPIs. Firstly, the on-time delivery rate as a measure of delivery reliability: A figure below 90 per cent indicates a reactive mode; above 95 per cent marks the start of the proactive range; in the automotive sector, 97 to 99 per cent is standard. The APQC benchmarks for forecast accuracy show that top performers in terms of delivery readiness systematically employ different planning processes to the average.
Secondly, forecast accuracy as an indicator of planning quality. For stable product lines, a forecast accuracy of 75 to 85 per cent is realistically achievable. More important than the absolute figure is the direction of improvement: does it improve following a change in parameters? The linked article explains that key performance indicators for planning quality encompass more than just forecast accuracy.
Thirdly, the ‘firefighting rate’ as the simplest indicator of maturity: the percentage of unplanned activities out of the total planning time. As long as this figure remains above one-third, the supply chain is still operating in reactive mode, regardless of which systems are in use.
Maturity level | Level of readiness for delivery | Forecast Accuracy | Fire service quota |
Reactive | under 90% | under 65% | above 50% |
Adaptive | 90 to 95% | 65 to 75% | 20 to 50% |
Proactive | above 95% | above 75% | under 20% |
In addition to these lagging KPIs, leading KPIs aid early detection: supplier lead time variance, forecast stock-outs and demand-sensing deviation provide indications of what is on the horizon before the lagging KPIs pick it up.
What does a realistic transformation roadmap look like?
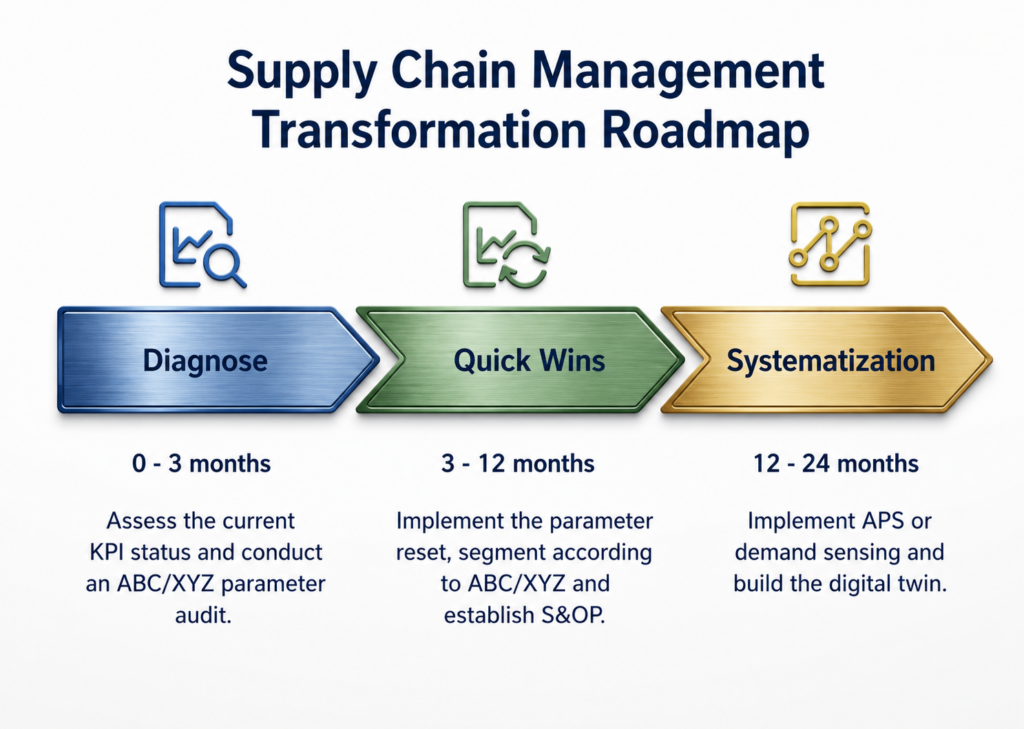
A realistic transformation from reactive to proactive supply chain management takes place in three phases: Diagnosis (0 to 3 months), Quick Wins (3 to 12 months) and Systematisation (12 to 24 months). Anyone who starts by purchasing a system before data quality and planning roles have been clarified risks an expensive Phase 3 without the quick wins from Phase 2. This is the most common mistake in SCM transformation projects.
Phase 1: Diagnosis (0 to 3 months). Assess the current KPI status using the maturity model from the previous section. Carry out an ABC/XYZ parameter audit: Which safety stock levels are no longer aligned with actual lead times? Which product groups generate a disproportionately high number of planning interventions? Check the data quality for plausibility. Only once these findings are available is the groundwork laid for quick wins.
Phase 2: Quick Wins (3 to 12 months). Implement the parameter reset, segment by ABC/XYZ and derive differentiated replenishment strategies. Introduce S&OP or refine it if it exists in name only but is not being implemented in practice. Define a pilot area with measurable KPI targets and assign responsibilities. The first visible improvements can realistically be expected within 6 to 12 weeks.
Phase 3: Systematisation (12 to 24 months). Introduce APS or demand sensing, now built on a foundation of refined data quality. Develop the digital twin for scenario testing. Scale exception management across the entire system. For APS systems, typical implementation timescales and ROI expectations are generally such that the first visible improvements occur after 3 to 6 months, with full ROI achieved after 12 to 24 months.
Building proactive resilience rather than resorting to ad hoc firefighting – that is, establishing buffers and safety nets before disruptions occur – forms part of the systematisation phase.
Based on our project experience, the following applies: transformation cannot be achieved through technology investments alone. It succeeds when data quality, organisational structure and technology are addressed in that order.
Key Takeaway
Proactive supply chain management identifies disruptions before they escalate. Reactive supply chains show measurable results: on-time delivery rates below 90 per cent, a proportion of express freight above the industry average, and more than 30 per cent of planning time spent on unplanned interventions.
The quickest lever is resetting the planning parameters: in projects carried out by Abels & Kemmner, the ‘firefighting’ rate fell by 50 per cent and stockholding costs by 18 per cent within six months, without changing the system. A typical reduction in stock levels is 15 to 30 per cent.
Organisational prerequisites must be in place before any technology investment: an S&OP cycle, clear escalation rules and separate planning hierarchies are essential.
Four technologies make the greatest contribution: demand sensing (5 to 20 per cent improvement in forecasting), APS systems, the digital twin as a wind tunnel, and automated parameterisation.
The level of maturity can be measured using three KPIs: on-time delivery rate (target 95 per cent or more), forecast accuracy (target 75 to 85 per cent) and firefighting rate (target below 20 per cent).
The transformation takes place in three phases: Diagnosis (0 to 3 months), Quick Wins (3 to 12 months), and Systematisation with APS and the Digital Twin (12 to 24 months).
FAQ – Frequently Asked Questions
What is the difference between reactive and proactive supply chain management?
Reactive supply chain management responds to disruptions as they occur: missing parts, delivery delays and capacity bottlenecks are dealt with as they arise. Proactive SCM identifies these signals at an early stage using leading KPIs and real-time data, and takes action before problems escalate. The fundamental difference lies in the timing of decision-making: before the problem arises, rather than after. Further details can be found in the comparison table above.
How long does it take to make the transition to proactive supply chain management?
Realistically, the transformation takes place in three phases:
Phase 1: Diagnosis: 0 to 3 months (current KPI status, parameter audit, data quality)
Phase 2: Quick Wins: 3 to 12 months (parameter reset, S&OP, pilot project)
Phase 3: Systematisation: 12 to 24 months (APS, demand sensing, digital twin)
The first measurable improvements can be achieved as early as 6 to 12 weeks after the parameter reset.
Which KPIs indicate whether my supply chain is being managed proactively?
Three groups of key performance indicators reliably indicate the level of maturity:
Delivery readiness (delivery reliability): proactive range from 95 per cent; automotive standard 97 to 99 per cent
Forecast accuracy: target range 75 to 85 per cent for stable product lines
Firefighting rate: proportion of unplanned planning activities; proactively below 20 per cent
In addition, leading KPIs such as supplier lead time variance provide early warning signals.
Do I need a new ERP system for proactive supply chain management?
No. A new ERP system is not required to start using proactive management. The most significant lever – the reset of planning parameters – can be implemented in any existing ERP system. APS solutions and demand-sensing tools complement the existing ERP system as a planning layer. The priority is first to ensure data quality in the existing system, then, where necessary, to supplement this with specialised planning tools.